
How Much AQI is Good for Health?
Air quality plays a significant role in public health, and the Air Quality Index (AQI) is a key indicator used to measure pollution levels. Understanding AQI is crucial for taking necessary precautions and ensuring a healthier environment.
Understanding the Air Quality Index (AQI) 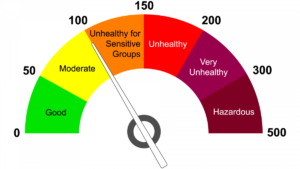
The AQI is a scale that runs from 0 to 500, indicating the level of air pollution and its potential health effects. A lower AQI represents cleaner air, while a higher AQI signifies increased pollution levels and associated health risks.
AQI Categories and Health Impacts
- 0 – 50 (Good): Air quality is considered satisfactory, and pollution poses little or no risk to the general public.
- 51 – 100 (Moderate): Air quality is acceptable; however, some pollutants may cause minor health concerns for sensitive individuals, such as those with respiratory conditions.
- 101 – 150 (Unhealthy for Sensitive Groups): People with lung diseases, older adults, and children may experience health effects. The general public is not likely to be affected.
- 151 – 200 (Unhealthy): Everyone may begin to experience adverse health effects, with sensitive groups facing more serious consequences.
- 201 – 300 (Very Unhealthy): A health alert is issued, indicating increased health risks for the entire population.
- 301 – 500 (Hazardous): A health emergency is declared, as air pollution levels pose severe health risks to all individuals.
Air Data: Basic Information
The AirData website provides access to air quality data collected at outdoor monitors across the United States, Puerto Rico, and the U.S. Virgin Islands. The data primarily comes from the Air Quality System (AQS) database. Users can view and analyze data in multiple ways, including:
- Downloading raw data files
- Generating standard reports
- Creating graphical displays
- Using an interactive map to explore monitor locations
AirData serves a diverse audience, including concerned citizens, air quality analysts, regulatory agencies, and academic researchers. The platform allows users to access monitored hourly, daily, and annual AQI data and analyze speciated particle pollution data.
What Can You Do with AirData?
AirData provides four key functionalities:
- Download Data: Users can access raw data or daily summaries through query tools.
- Reports (Summary and Technical): Generate customized reports based on selected parameters.
- Air Quality Index Report: Provides yearly AQI summaries for specific cities or counties.
- Air Quality Statistics Report: Shows yearly summaries of air pollution levels.
- Monitor Values Report: Provides detailed measurements from individual monitoring sites.
- Hazardous Air Pollutants Report: Displays data on harmful air pollutants at monitoring locations.
- Daily AQI Values Report: Shows daily air quality index values for selected locations.
- Visualize Data: Offers interactive visualization tools to help users understand pollution trends.
- AQI Plot: Compares AQI values for different pollutants over a year.
- Tile Plot: Represents daily AQI levels using color-coded squares.
- Concentration Plot: Shows time-series air quality data for different pollutants.
- Concentration Map: Provides an animated view of daily pollutant concentrations.
- Ozone Exceedances Plot: Compares ozone pollution levels across different years.
- Interactive Map: Displays air quality monitoring sites and allows users to download data from specific monitors.
Basic Air Quality Concepts
Types of Air Quality Data
- Monitoring Data: Collected from over 4,000 monitoring stations operated mainly by state environmental agencies. This data is sent to the EPA’s AQS database for public access.
- Emissions Data: Tracks pollution sources such as vehicles, industries, and power plants. However, AirData does not currently include emissions data.
Types of Air Pollutants
- Criteria Air Pollutants: The EPA regulates six key pollutants under national air quality standards:
- Ozone (O3)
- Particulate Matter (PM10 and PM2.5)
- Carbon Monoxide (CO)
- Nitrogen Dioxide (NO2)
- Sulfur Dioxide (SO2)
- Lead (Pb)
- Hazardous Air Pollutants (HAPs): Also known as toxic air pollutants, these are substances linked to serious health conditions such as cancer. The EPA has identified 188 hazardous air pollutants, including benzene, dioxins, and heavy metals like mercury and lead.
How AQI Affects Public Health
The AQI provides critical information on air pollution levels and their potential health impacts. For instance:
- AQI below 100 is generally safe for the public.
- AQI above 100 can pose risks, particularly for sensitive groups such as children, the elderly, and individuals with pre-existing health conditions.
- AQI above 200 requires immediate public health interventions as pollution levels become harmful to all individuals.
By monitoring AQI levels, governments and health organizations can implement measures to protect public health, such as issuing warnings, enforcing pollution control regulations, and encouraging environmentally friendly practices.
Conclusion
A “Good” AQI (0-50) ensures safe and healthy air for everyone, while higher levels indicate potential health risks. The AirData platform plays a crucial role in monitoring and analyzing air quality, helping individuals and policymakers make informed decisions. Staying informed about air quality trends and taking necessary precautions can significantly reduce health risks associated with air pollution.