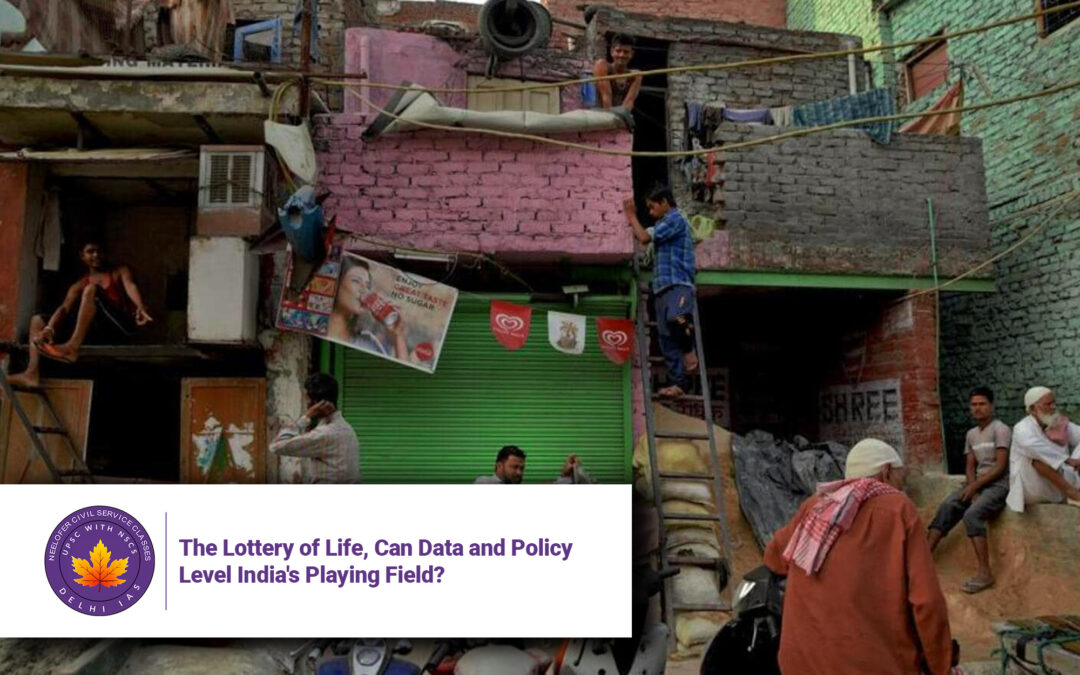
The Lottery of Life, Can Data and Policy Level India’s Playing Field?
Introduction
In a world where a cab driver’s daughter can dream of becoming a billionaire, while a Dalit farmer’s son struggles for basic nutrition, India’s socio-economic inequalities remain starkly rigid. The 2024-25 Socio-Economic Caste Census (SECC) promises to expose these divides with unprecedented granularity, but can data alone rewrite the “lottery of birth”? This analysis explores how structural barriers, policy gaps, and the tyranny of luck perpetuate inequality—and proposes a roadmap for meaningful intervention. 
1. The Anatomy of Inequality: Where Birth Determines Destiny
The Four Pillars of Privilege
| Factor | Advantage | Disadvantage |
|---|---|---|
| Caste | Upper-caste networks boost job access 5x | SC/STs earn 32% less for same work |
| Geography | Urban kids attend English-medium schools (87%) | Rural kids face teacher absenteeism (25%) |
| Parental Education | Children of grads 3x more likely to enter IITs | First-gen learners drop out at Class 10 (48%) |
| Gender | Men dominate 92% of STEM enrollments | Women’s LFPR stagnates at 25% |
Data Point: 90% of India’s billionaires come from 3 communities (Banias, Brahmins, Parsis).
2. When Luck Amplifies Inequality
The “Mediocrity of Luck” Paradox
-
Physics Research (Plutino et al.): In simulations, mediocre-but-lucky individuals outperformed talented peers 68% of time.
-
Stock Market Reality: Top 1% traders owe 55% of gains to random volatility (SEBI 2023 study).
India’s “Traffic Jam” Problem
-
Hirschman-Rothschild Theory: Inequality is tolerated only if mobility exists.
-
Example: When OBC quotas helped 6M families enter middle-class (2005–20), resentment was low.
-
Crisis Point: SC/STs still underrepresented in pvt sector (<4% of corporate leadership).
-
3. Affirmative Action: Hits and Misses
Successes
-
Education: SC/ST enrollments in colleges tripled since 1990.
-
Politics: 543 SC/ST MPs elected since 1952 vs. 0 in 1947.
Failures
| Policy Gap | Consequence |
|---|---|
| Creamy Layer Freeze | Quotas benefit top 10% of OBCs only |
| Private Sector Opt-Out | 92% of Fortune 500 India firms have <5% Dalit hires |
| Data Lag | 1931 caste data was last full census |
4. The 2024 SECC: A Game Changer?
What’s New
-
Caste × Economics: First-ever cross-tabulation of caste with income/assets.
-
Digital Integration: Linked to Aadhaar, tracking mobility over time.
Limitations
-
Static Snapshot: Cannot capture real-time changes like job loss.
-
Implementation Risks:
-
Underreporting: Fear of losing welfare benefits.
-
Overreach: Potential misuse for vote-bank targeting.
-
5. A 5-Point Blueprint for Equity
1. Dynamic Disadvantage Index
-
Parameters: Caste + parental education + regional development index.
-
Example: A rural Dalit girl in Bihar scores 8.9/10 (vs. urban Brahmin boy at 2.1).
2. Private Sector Mandates
-
Phased Quotas: Start with 5% SC/ST hiring in firms >500 employees.
-
Incentives: Tax breaks for diverse leadership (like UK’s Parker Review).
3. “Opportunity Infrastructure”
-
Mobility Corridors:
-
Education: Bridge English fluency gaps via AI tutors (e.g., Khan Academy Lite).
-
Jobs: Skill vouchers for marginalized youth to access NSDC courses.
-
4. Luck-Neutralizing Policies
-
Universal Basic Assets:
-
Land: Titling for 2M landless Dalit families.
-
Capital: ₹10L startup grants for SC/ST women entrepreneurs.
-
-
Insurance Nets: Job loss coverage for gig workers (inspired by Denmark’s flexicurity).
5. Real-Time Equity Dashboard
-
Live Tracking: Monitor representation gaps in education/jobs.
-
AI Alerts: Flag districts where mobility stagnates (e.g., Bundelkhand).
6. Global Lessons: What Works
Positive Discrimination Done Right
| Country | Policy | Outcome |
|---|---|---|
| Brazil | Race-based university quotas | Black enrollment up from 2% to 18% |
| Malaysia | Bumiputera biz licenses | 30% corporate equity to Malays |
Data-Driven Mobility
-
UK’s ONS: Tracks parent-child earnings link to measure rigidity.
-
Norway’s “Birth Lottery” Corrections: Free childcare + housing for low-income families.
7. The Cost of Inaction
Projected 2030 Scenario
| Factor | If Reforms Delayed | If Reforms Implemented |
|---|---|---|
| Social Unrest | 2x rise in caste violence | 50% reduction |
| GDP Loss | 1.5% yearly from instability | 0.5% gain via inclusive growth |
| Brain Drain | 500K/yr talent flight | Reverse migration of skilled NRIs |
Conclusion: Rewriting the Lottery Tickets
As Pratap Bhanu Mehta argues, “Inequality is a choice, not destiny.” The 2024 SECC provides the diagnosis; now India needs the treatment. By combining dynamic data, private-sector accountability, and asset redistribution, India can transform the “lottery of birth” into a ladder of opportunity.
The alternative—a society where accidents of birth dictate life outcomes—is morally indefensible and economically unsustainable. The time to act is now.
Key Questions & Answers
-
How does caste still affect mobility?
-
SC/STs face 52% wage gaps and 3x higher dropout rates (NSSO 2023).
-
-
Can luck be mitigated by policy?
-
Yes: Asset redistribution and skills training reduce dependency on chance.
-
-
Why include private sector in quotas?
-
93% of India’s jobs are private, where caste ceilings persist.
-
-
What’s the #1 reform needed?
-
Real-time disadvantage tracking to target policies precisely.
-
-
Will SECC data be misused?
-
Risks exist but are outweighed by transparency benefits (court oversight recommended).
-