Inequality in India, Parsing the World Bank’s Spring 2025 Report
Why in News?
The World Bank’s recently released Spring 2025 “Poverty and Equity Brief” has made global headlines by suggesting that India may now be the fourth most equal country in the world in terms of income inequality. This revelation has surprised many, as it contradicts the longstanding understanding of widening inequality in India. The report draws attention due to its data-backed assertions, which claim a decline in both extreme poverty and consumption inequality. 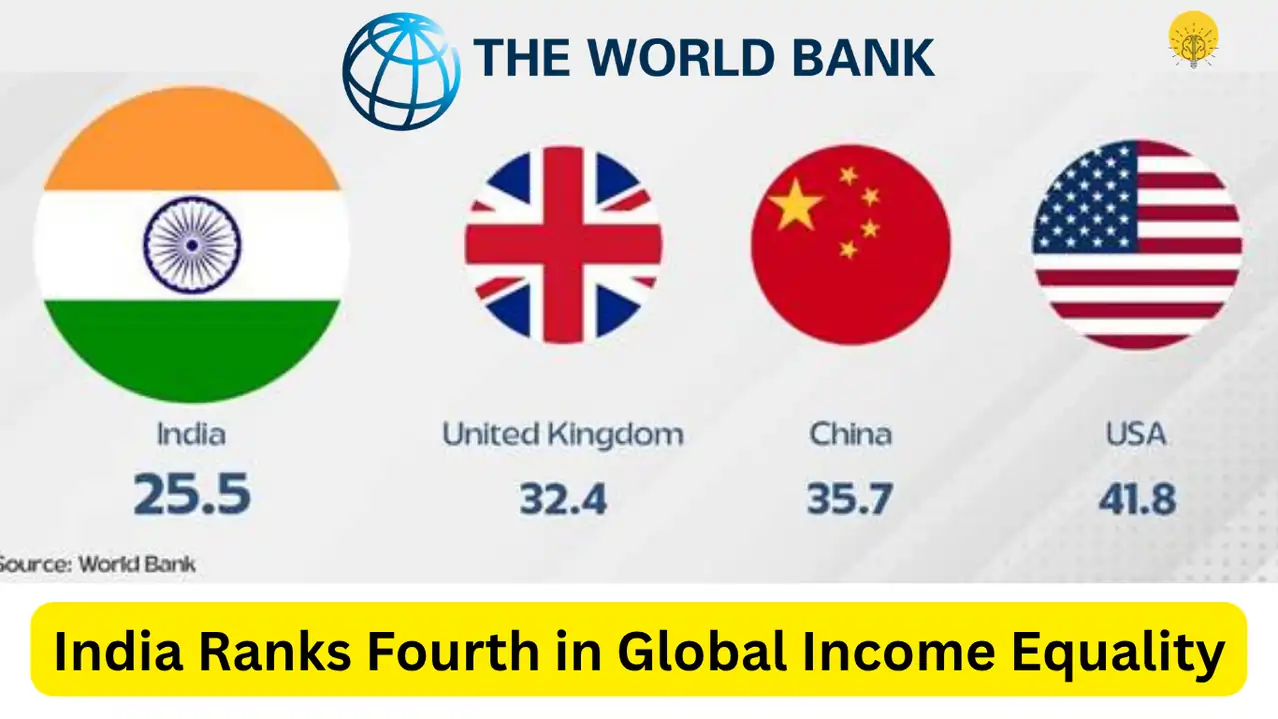
Introduction
The Spring 2025 World Bank report has sparked widespread debates among economists, policymakers, and public intellectuals. According to its findings, India has seen a sharp decline in extreme poverty and a significant reduction in consumption inequality, raising the possibility that the country might be among the world’s most equal in terms of income distribution.
However, this claim stands in contrast to a large body of research and empirical data over the past decades that suggests the opposite—growing income and wealth disparities in India. Therefore, understanding the methodology, metrics, and broader implications of this report becomes essential for grasping its real significance.
Key Issues Highlighted in the Report
-
Decline in Consumption Inequality
-
The report uses the Gini Index of consumption to argue that inequality has reduced.
-
The Gini Index fell from 0.28 in 2011 to 0.25 in 2022, indicating narrowing disparities in consumption.
-
This is notable given that most countries struggle to reduce inequality, and India has long been associated with rising disparities.
-
-
Sharp Fall in Extreme Poverty
-
The percentage of Indians living below the $3.00/day threshold (adjusted for purchasing power parity) fell from 27.1% in 2011 to 5.3% in 2022-23.
-
Even more impressively, those below $2.15/day fell to just 2.3%.
-
The figures indicate transformational changes in standards of living, at least in terms of consumption.
-
-
Structural Welfare Reforms
-
The report acknowledges a series of government reforms that helped reduce poverty and improved delivery of benefits.
-
These include:
-
56 crore Jan Dhan accounts
-
Aadhaar-linked services
-
Direct Benefit Transfers (DBTs)
-
-
These initiatives reduced leakages, improved access to welfare, and strengthened the state’s role in uplifting the poor.
-
-
The ‘Empowerment and Capability’ Critique
-
The report also points out that while consumption metrics show improvement, income and wealth inequality may still remain high.
-
A broader framework of capability-building and empowerment, through education, job training, and skilling, is essential for sustained improvement.
-
-
Measurement Gaps and Alternate Metrics
-
Critics argue that Gini indices based on consumption data from the National Sample Survey may not fully reflect true income inequality.
-
India’s income-based Gini is still high, estimated at 0.49, which is closer to global averages for developing nations.
-
Hence, the measurement tools used may understate real inequality levels.
-
Five Key Takeaways from the World Bank Report
-
India has made substantial progress in reducing extreme poverty over the last decade, driven by welfare schemes and basic service delivery.
-
Consumption inequality has narrowed, as evidenced by falling Gini coefficients.
-
The data used to measure inequality may not capture income disparities, especially among the richest.
-
Structural reforms like DBTs and Aadhaar have created more efficiency in welfare delivery, though concerns remain about empowerment.
-
India’s future focus must go beyond consumption metrics and address root causes of inequality like education, employment, and wealth concentration.
Challenges and the Way Forward
Despite the report’s optimism, important caveats remain. The use of consumption data as a primary measure of inequality has been challenged by several experts:
-
Income and wealth data are either missing or poorly captured, especially for the top 1% of earners.
-
Gini coefficient based on consumption often understates true inequality, as wealthier individuals may underreport or distribute consumption differently.
-
The methodology, sample design, and questions used in household surveys may miss extreme wealth or income concentrations.
The World Bank does acknowledge this in its report, stating that while India appears more equal in consumption terms, it still struggles with wider forms of inequality, particularly in wealth, land ownership, and educational access.
Therefore, a broader strategy is needed, including:
-
Improving Public Education Quality:
Universal access to education is not enough. Curriculum upgrades, teacher training, and digital infrastructure are needed. -
Expanding Vocational and Skill Training:
Government schemes must align training to market demand to ensure jobs for youth. -
Boosting Labor Participation and Job Creation:
India’s informal sector employs over 80% of workers. Formalization, credit access, and skilling are essential. -
Reducing Regional Disparities:
Many rural and backward states lag behind in poverty reduction and access to services. More state-specific schemes are required. -
Wealth Tax and Progressive Fiscal Policies:
To tackle wealth inequality, economists recommend wealth taxes or inheritance taxes for the ultra-rich.
Conclusion
The World Bank’s Spring 2025 Report paints a mixed picture. On one hand, poverty levels and consumption inequality have fallen, suggesting improved welfare and economic access. On the other, income and wealth inequality may still remain unaddressed.
It is possible that India’s recent welfare gains are real and significant. However, celebrating India as one of the world’s most equal societies may be premature. Much depends on how inequality is measured—consumption, income, or wealth—and how consistently data is collected and interpreted.
The way forward lies in focusing not just on reducing poverty, but in building long-term empowerment. That means ensuring every Indian—regardless of caste, gender, class, or region—has access to quality education, dignified work, fair wages, and upward mobility.
India’s development story should now pivot from minimum survival to maximum opportunity.
Q&A Section
Q1: What is the main claim of the World Bank’s Spring 2025 Report?
A: The report claims that extreme poverty in India has sharply declined, and consumption inequality has significantly reduced, suggesting that India might now be the fourth most equal country in the world in terms of consumption-based inequality.
Q2: What metric did the World Bank use to assess inequality in India?
A: The report uses the Gini coefficient based on consumption to assess inequality. According to the data, India’s Gini Index fell from 0.28 in 2011 to 0.25 in 2022, indicating reduced consumption inequality.
Q3: Why do critics disagree with the World Bank’s conclusion?
A: Critics argue that consumption-based data does not reflect true income and wealth inequality, especially since it underrepresents the wealthy. India’s income-based Gini coefficient remains high at 0.49, and wealth inequality is not fully captured in household surveys.
Q4: What factors contributed to the decline in poverty, as per the report?
A: The report credits government programs like Jan Dhan Yojana, Aadhaar, and Direct Benefit Transfers (DBTs) for improving access to welfare, reducing leakages, and enhancing the consumption capacity of the poor.
Q5: What does the report suggest for future inequality reduction in India?
A: The report suggests moving beyond consumption-based welfare toward long-term solutions such as:
-
Improving education quality
-
Job creation and skill development
-
Women empowerment
-
Decentralized governance
These will help address the root causes of inequality, rather than just its symptoms.